In our ongoing commitment to accurately measure the impact of our collective efforts, precise beneficiary reporting is crucial. The ability to effectively capture and analyze beneficiary data enables us to comprehend the transformative power of our initiatives truly. However, this process often entails complexities that can lead to misinterpretations and misrepresentations of our impact. Here, we delve into crucial insights to demystify beneficiary reporting and ensure a more accurate representation of the impact we collectively create.

Understanding the Intricacies of Beneficiary Reporting
Defining "Returning" and "New" Beneficiaries
When assessing beneficiary data, it's vital to distinguish between returning and new beneficiaries within the context of a specific period. For instance, consider the scenario of the calendar year:
- New beneficiaries: Individuals engaging for the first time within the current calendar year.
- Returning beneficiaries: Individuals who have engaged in previous calendar years but re-engage within the current year.
Visualizing Data with Mock-Up Tables:
Below is an illustrative example showcasing the attendance of individuals in our programs over a year (Illustrating the first four months):
| January | February | March | April | Total | |
|---|---|---|---|---|---|
| Individual A | 2 | 3 | 1 | 2 | 8 |
| Individual B | 1 | 0 | 4 | 2 | 7 |
| Individual C | 3 | 2 | 3 | 1 | 9 |
| Total, Unique | 3 | 2 | 3 | 3 | 2.75 (average) |
| Total | 6 | 5 | 8 | 5 | 24 |
| Average | 2 | 1.67 | 2.67 | 1.67 | 2 (24 / 3 people / 4 months) |
This table provides an overview of each month's individual beneficiaries' attendance, along with the total and average attendance.
Additionally, here is a table demonstrating the individuals as beneficiaries:
| Individual | Beneficiary Status |
|---|---|
| John | New Beneficiary |
| Sarah | Returning Beneficiary |
| Michael | New Beneficiary |
| Emily | New Beneficiary |
| David | Returning Beneficiary |
Grasping the Concept of "Unique" Counts
The table below showcases how unique counts are calculated for a given month:
| Attendance | Unique Count | |
|---|---|---|
| January | 25 | 20 |
| February | 30 | 25 |
| March | 28 | 22 |
| April | 25 | 20 |
Understanding that the "sum of distinct counts" may not reflect the "distinct count over the year," let's consider the following scenario: If you assist the same 100 people each month, the total assistance rendered remains 100 for the entire year. Similarly, if you help 100 completely different people each month, the total count for the year would amount to 1200 people. However, the average monthly assistance remains constant at 100 people, making it a more meaningful statistic in this context.
The Significance of Averaging
The average number of beneficiaries served per month can be calculated as follows:
Total beneficiaries over the year / Number of months
For instance, if we have 120 unique beneficiaries over 12 months, the average would be 10 beneficiaries per month.
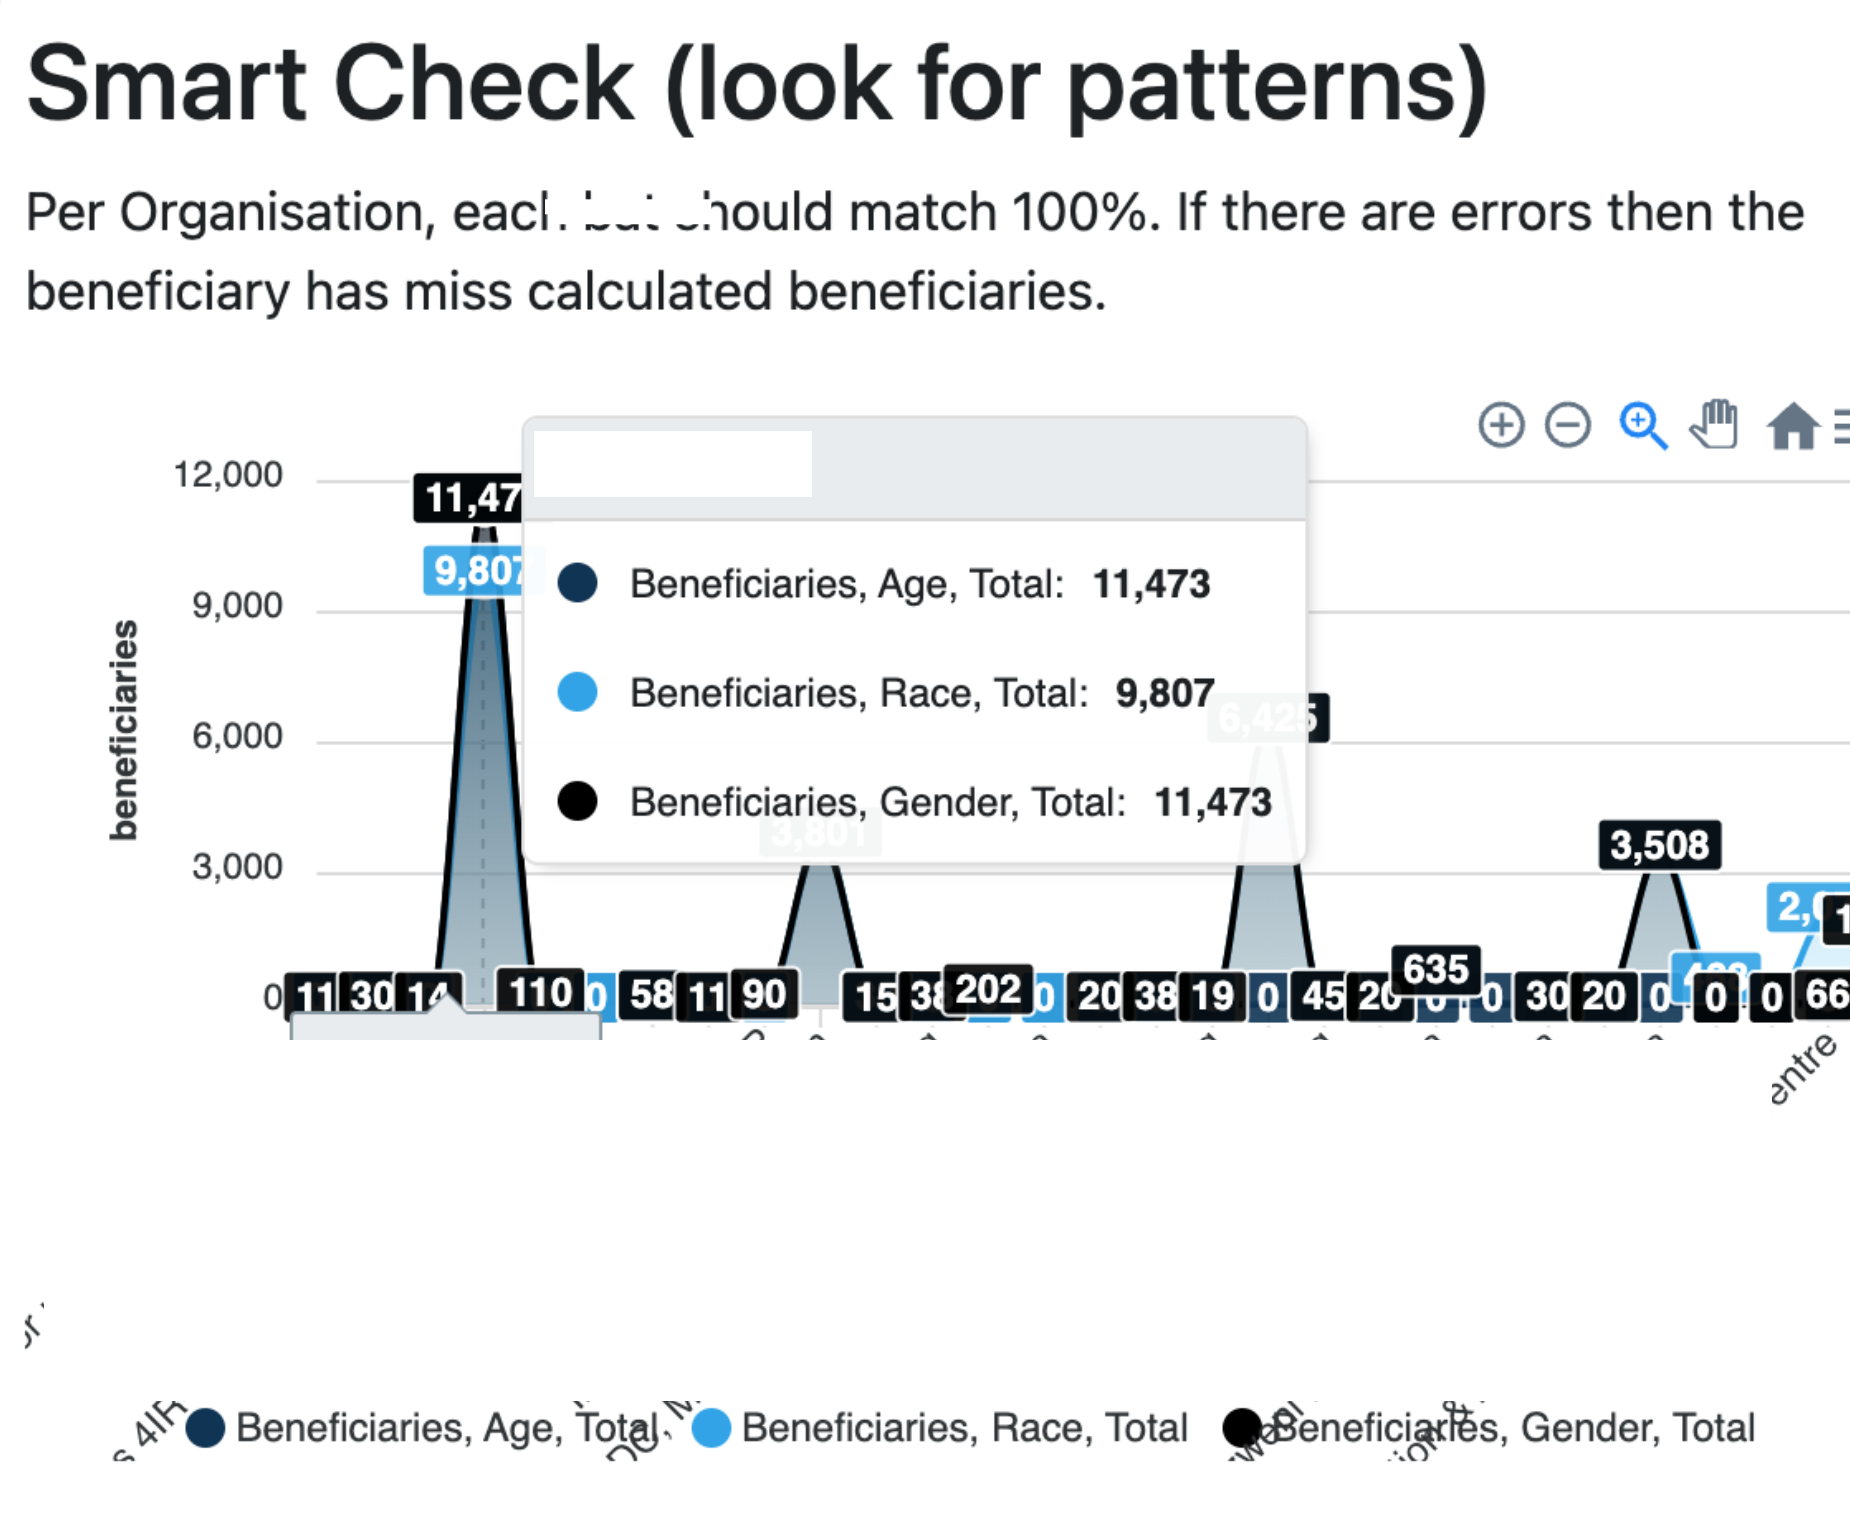
Identifying Discrepancies with Visual Representations
Utilizing tools such as charts and graphs in The Social Collective allows you to build comprehensive visualizations, enabling the identification of any discrepancies or errors in the reporting provided by our implementation partners.
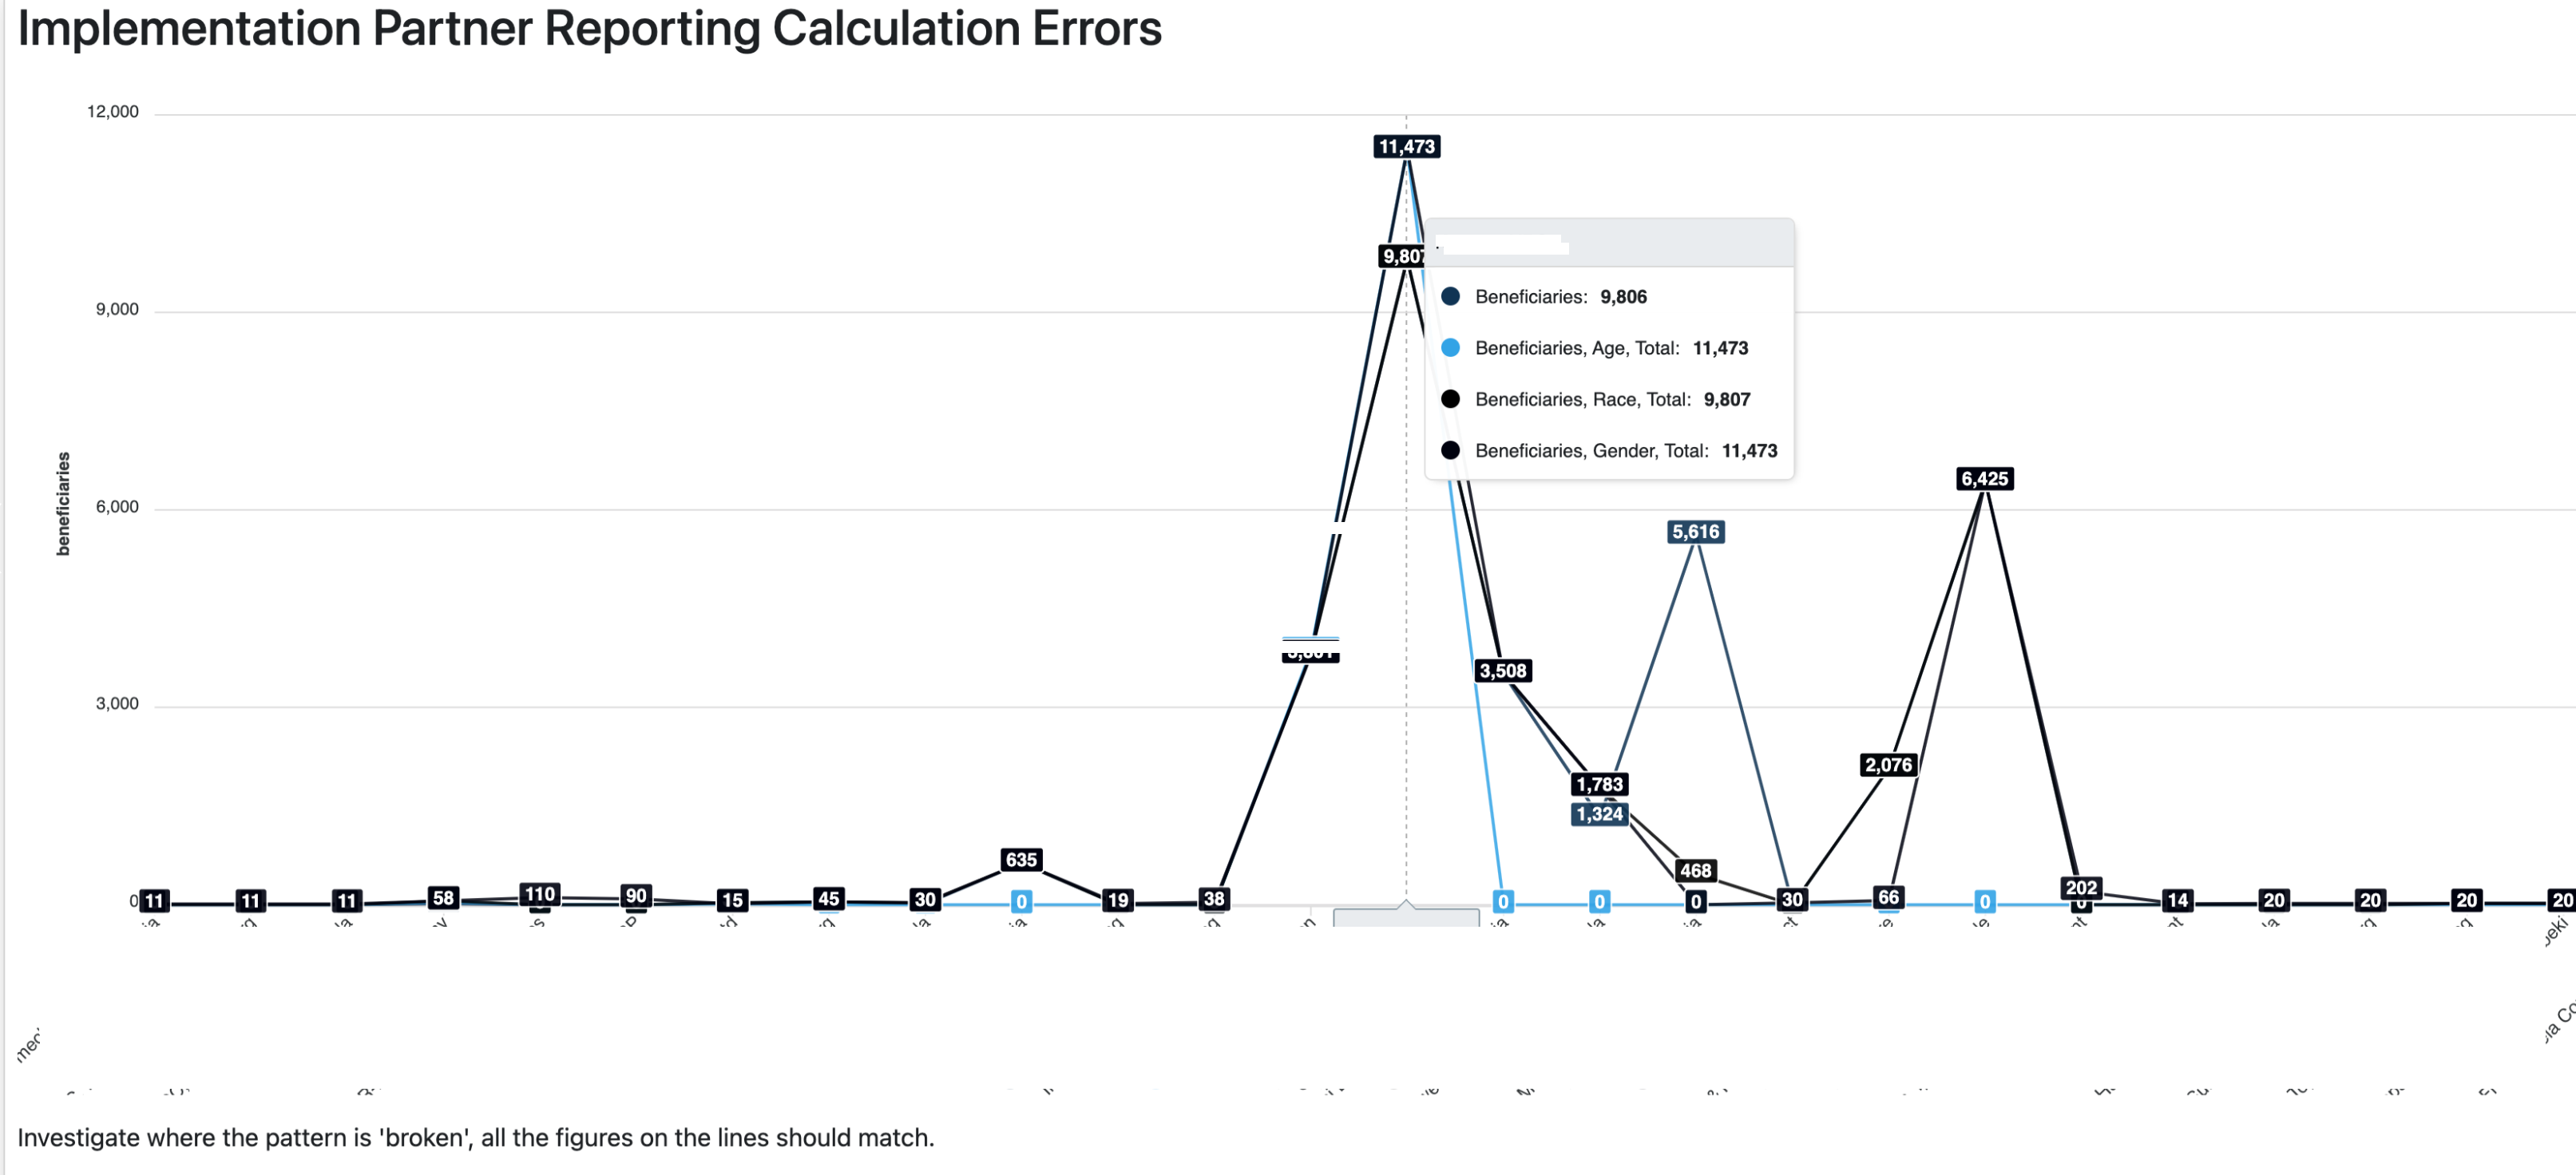
By visually representing the totals, your implementation partner can help you identify any overlooked calculation errors.
By presenting data through visualisations, statistical analysis helps to improve the quality of your data.
Understanding the Diversity of Program Types
We recognize that each program operates uniquely, some collecting attendance daily, others monthly, and some being annual programs with ad hoc beneficiary sessions. In such cases, your organization must maintain comprehensive and auditable records. Different systems and workflows manage various types of programs, and we encourage you to communicate with your funders to understand better the nuances of how information is collected. This proactive approach can help avoid any potential misreporting, ensuring that the impact of your work is accurately represented.
Our commitment to accurate and transparent reporting is unwavering. We believe in the power of data-driven insights to catalyze sustainable change, and your active participation remains pivotal in this journey.